I hadhave decided to use the AWS IoT communications platform in order to talk with our sensors.
However, when it comes to visualization, I was hoping it wouldn't be necessary to reinvent the wheel.
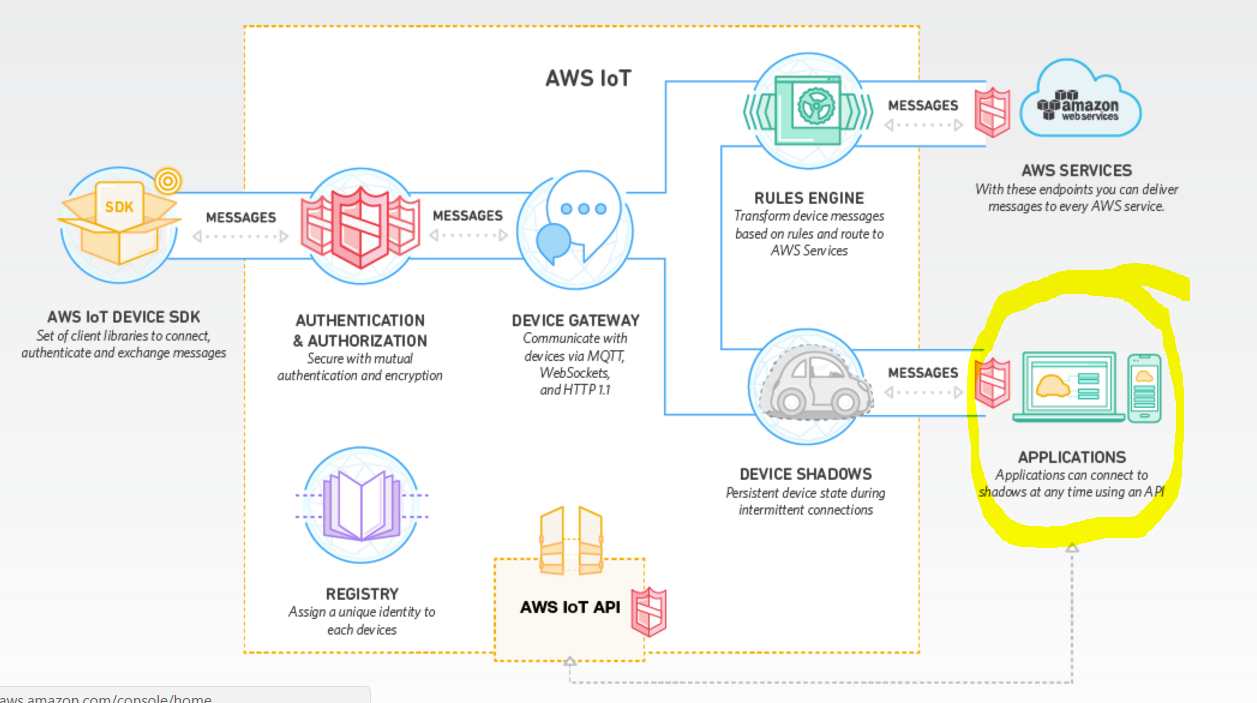
As you can see in the above picture, the IoT framework connects to an application server. My previous application experience was in a proprietary system based on PHP/MySQL & MongoDB.
There are a lot of platforms and most include a free trial, e.g.
I am looking for an open source visualization application platform upon which I can present the data to clients, allow secure customer access and customize as required.
Ideally, this platform would also include a database from which the data can be retrieved and even better again would be an indexing structure which ensures efficiency as the database grows. Maybe a framework that specifically provides visualization of device shadow registries that are common when monitoring IoT devices in the field.
To summarize, the ideal platform would include the following features:
- Administrator zone listing all the customers. Clicking a customer reveals their details.
- User Logon that bring a user to their dedicated area showing just the sensors which are allocated to them.
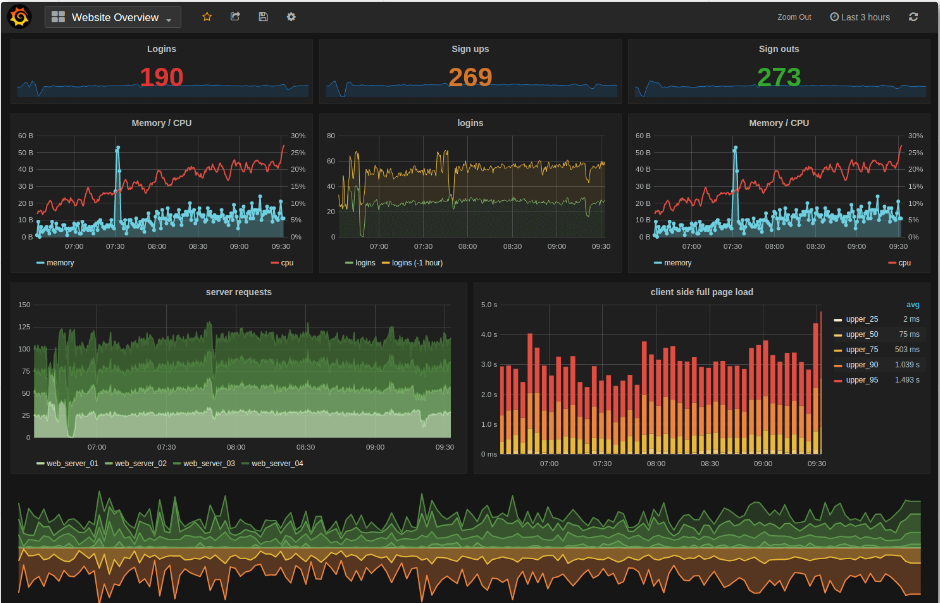
- User ability to view live trending data on visualization tools, (something like Grafana would be appropriate.

- Database Integration so that historical data can be stored and retrieved
- Ability to associate alarms and warnings with sensors and send an email to the people listed as requiring notification
Are there any such open source IoT application projects in existence that would meet my requirements?
