37

I have decided to use the AWS IoT communications platform in order to talk with our sensors.

However, when it comes to visualization, I was hoping it wouldn't be necessary to reinvent the wheel.

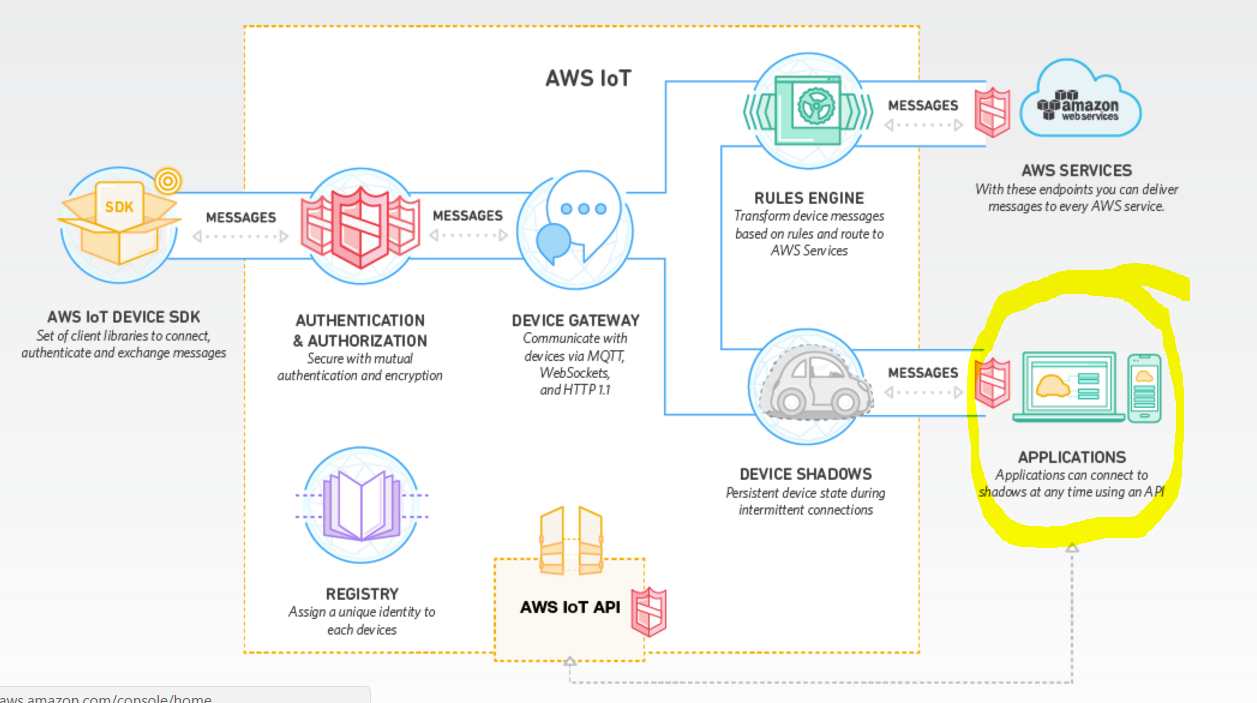
AWS IoT

As you can see in the above picture, the IoT framework connects to an application server. My previous application experience was in a proprietary system based on PHP/MySQL & MongoDB.

There are a lot of platforms and most include a free trial, e.g.

I am looking for an open source visualization application platform upon which I can present the data to clients, allow secure customer access and customize as required.

Ideally, this platform would also include a database from which the data can be retrieved and even better again would be an indexing structure which ensures efficiency as the database grows. Maybe a framework that specifically provides visualization of device shadow registries that are common when monitoring IoT devices in the field.

To summarize, the ideal platform would include the following features:

  • Administrator zone listing all the customers. Clicking a customer reveals their details.
  • User Logon that bring a user to their dedicated area showing just the sensors which are allocated to them.
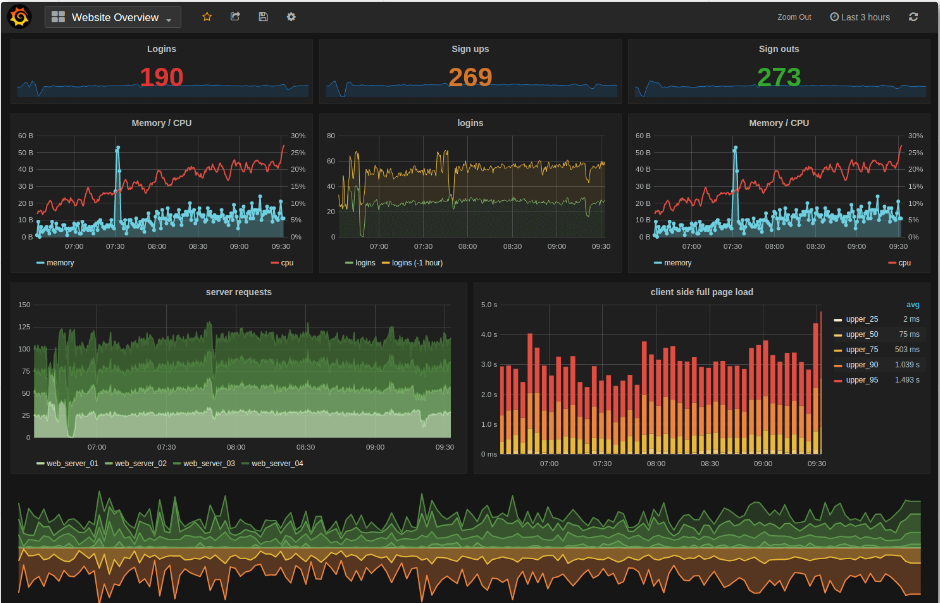
  • User ability to view live trending data on visualization tools, (something like Grafana would be appropriate. Grafana
  • Database Integration so that historical data can be stored and retrieved
  • Ability to associate alarms and warnings with sensors and send an email to the people listed as requiring notification

Are there any such open source IoT application projects in existence that would meet my requirements?
1
  • 14
    IoT visualization is nothing different from any other visualization, you can find many open source projects(eg: d3 JS library),Kibana,Graphite.
    – bravokeyl
    Commented Dec 7, 2016 at 10:40

5 Answers 5

11

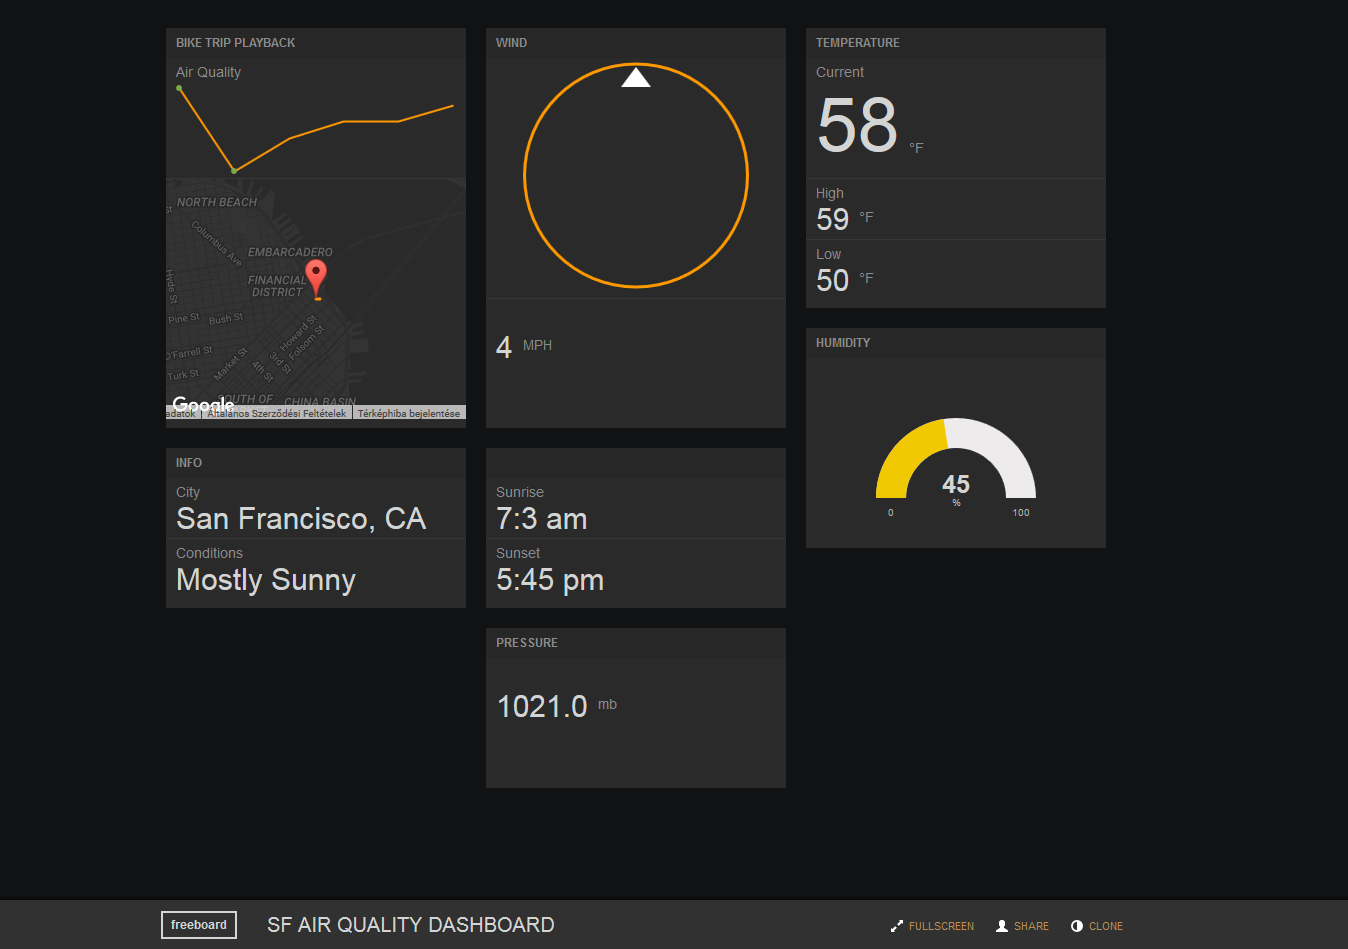
You can consider using freeboard.io that offers dashboards like this for example:

enter image description here

You can create unlimited public dashboards for free and limited private if you willing to pay monthly fees.

The project itself is open source and hosted on GitHub.

1
  • Used it previously, it's proprietary rather than open source.
    – SeanJ
    Commented Mar 21, 2017 at 22:56
8

You might want to have a look at cooja. It is a simulator/development environment for systems of devices running the Contiki operating system.

You can simulate different kinds of sensors and radio protocols and see how it works out.

0
7

Were you able to try out WSO2 IoT server? I have tried it and it has pretty cool features. And you can find the the source code here in GitHub.

I am looking for an open source visualization application platform upon which I can present the data to clients, allow secure customer access and customize as required.

It is 100% open source, it has real time as well as batch analytics capabilities with data visualization and allow secure customer access. It ensures secure device and app access through identity management and authorization. It incorporates with OAuth 2.0 token-based access control.

If you want to try out the product before going through the code you can simply download the server from here, and try out the sample device types that they have provided. They have sample call "Virtual Fire Alarm" and it basically give you a high level idea on what the server can do. You can try this sample without having any physical devices or sensors. Check here.

They also have a complete EMM solution inside the IoT Server. Also they have a device type call "Android sense" where you can read all the sensor data of an Android device and publish those data to the WSO2 IoT server for real time analytics.

You can find the complete documentation for WSO2 IoT server latest version here

In addition they have a cloud based solution as well which is very similar to the AWS IoT. Check here.

6

uBeac is a new freeware visualization tools which we have developed and it is Beta version. It is not opensource, but fully free to use.

You can define a gateway and you will get a unique URI. You can set the URI in you gateway or device to send HTTP/MQTT data to.

These are some of its features:

  • Team, building, floor plan definition
  • Real-time data visualization
  • Custom dashboard design using different widgets
  • Define sensor types, units, and prefixes Map visualization
  • ...

It supports generic Json data format and different predefined gateway as well. If you don't want to use predefined payload formats, they are open to develop your custom payload processing.

3

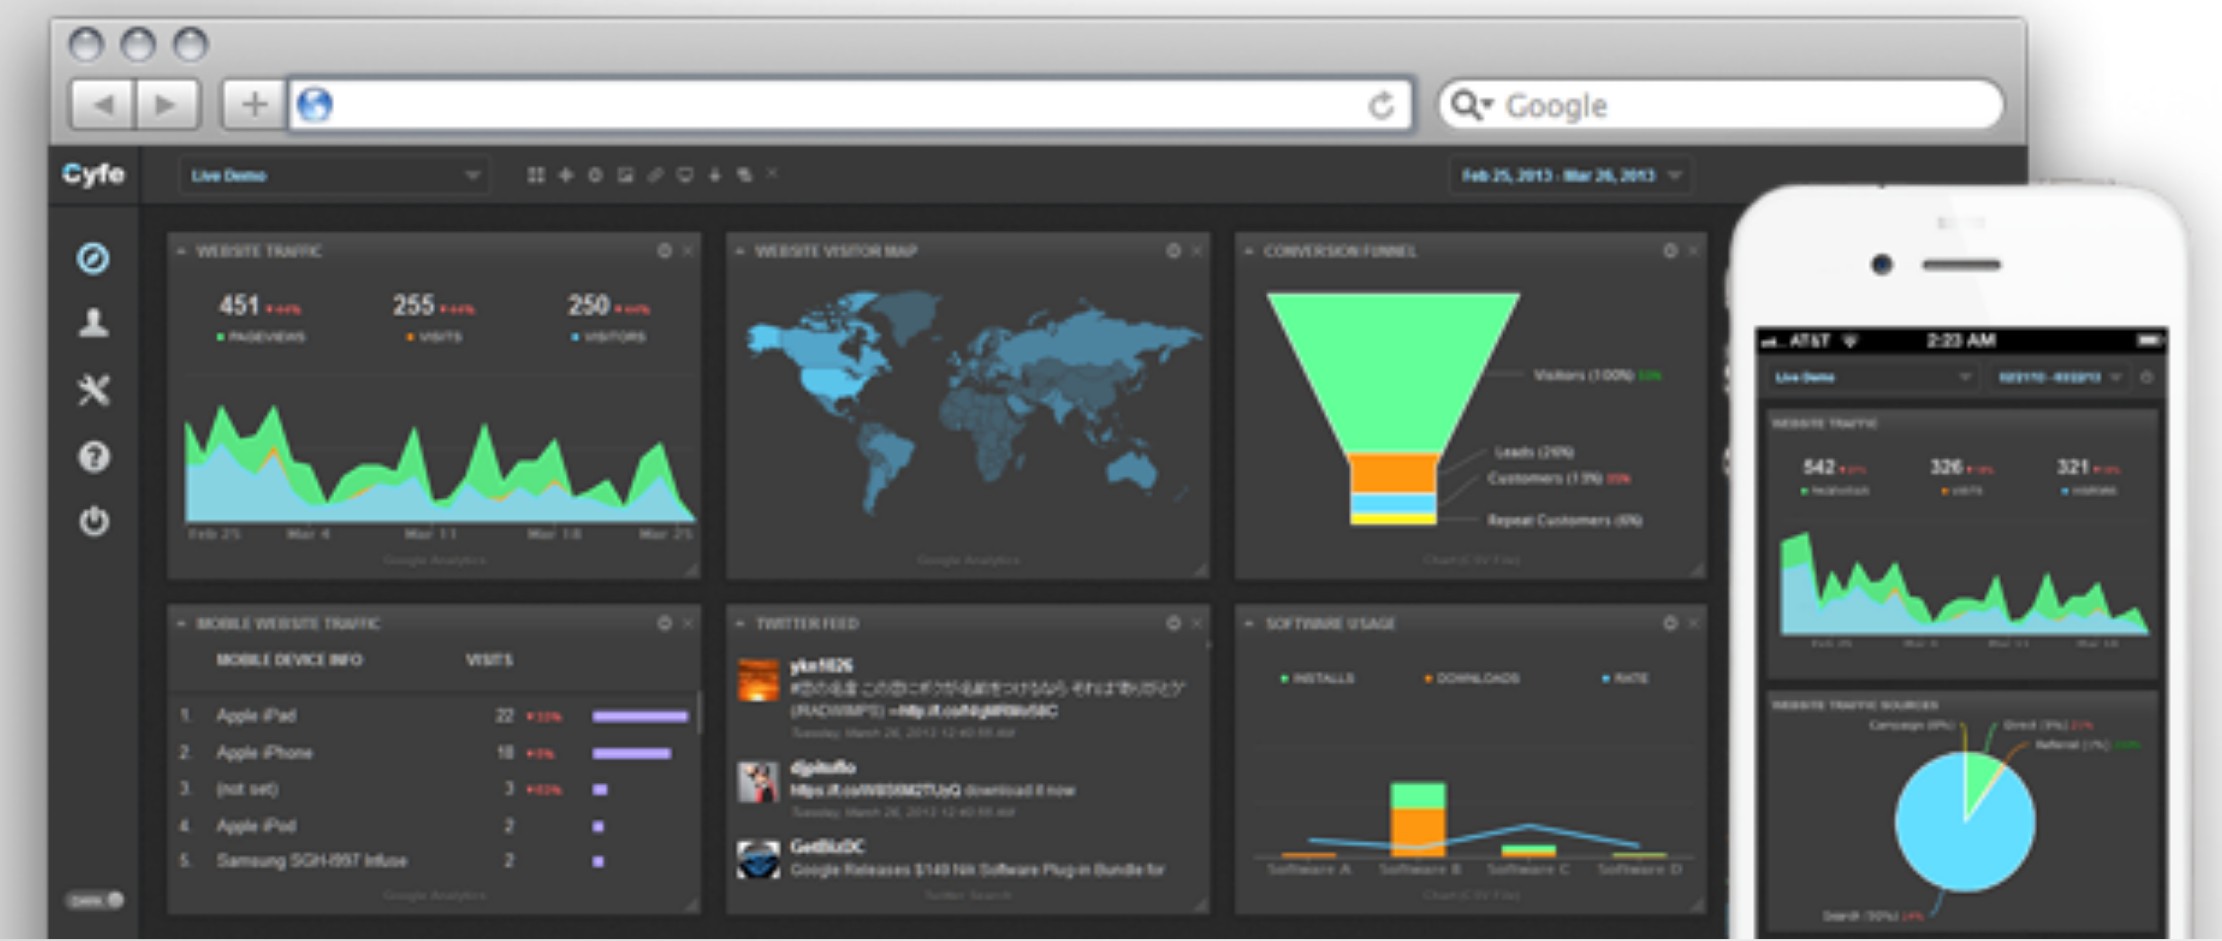
Cyfe.com is another example of dashboard.

  • Custom Data Source

  • Custom widgets

  • Push API

  • TV mode, with rotation

  • Etc.

Cyfe dashboard

2
  • This is not open-source, right? I believe this post is not relevant to the question.
    – Andrew
    Commented Mar 27, 2017 at 15:43
  • No you're right. But it's freeware. Commented Mar 28, 2017 at 6:00

Your Answer

By clicking “Post Your Answer”, you agree to our terms of service and acknowledge you have read our privacy policy.

Not the answer you're looking for? Browse other questions tagged or ask your own question.